

Your launch can attract plenty of attention without proving buyers got what they needed. In month one, product launch metrics should guide product marketing decisions and sharpen your go to market strategy.
For an AI art bundle, prompt pack, or workshop, leading indicators show early engagement; lagging indicators reveal purchases and returns. Use both to choose your next step: improve the offer, fix delivery, support beginners, or expand promotion.
Start with a small dashboard, then interpret each number alongside its audience and timing.
Key Takeaways
- Track a small set of product launch metrics tied to decisions, including qualified traffic, purchase conversion, activation, repeat engagement, refunds, and net sales revenue.
- Interpret leading indicators alongside lagging outcomes. Strong engagement with weak sales points to a different issue than strong sales followed by refunds.
- Define each metric and its denominator consistently, and compare equivalent audiences and cohorts at the same stage of their buying or usage journey.
- Measure activation through a meaningful first-use result, not downloads alone, and use customer feedback to explain where buyers get stuck.
- Treat month-one results and forecasts cautiously. Review results on a set schedule, account for costs and timing, and make changes based on the clearest observed bottleneck.
Build a Dashboard You Can Act On
Choose metrics that answer business questions, rather than collecting everything your tools display. A spreadsheet is enough to track a compact set of key performance indicators for a first launch.
These six measures offer a practical starting point.
| Measure | How to calculate or track it | Decision it supports |
|---|---|---|
| Qualified traffic | Product-page visitors from relevant sources | Whether your promotion reaches likely buyers |
| Purchase conversion | Unique buyers divided by unique product-page visitors, multiplied by 100 | Whether the offer persuades visitors |
| Activation | Buyers reaching a defined first-use milestone divided by eligible buyers, multiplied by 100 | Whether buyers can get started |
| Repeat engagement | Eligible buyers completing another meaningful action within a set window | Whether the product supports continued use |
| Refund rate | Refunded orders divided by orders from the same purchase group, multiplied by 100 | Whether expectations match delivery |
| Net sales revenue | Sales revenue minus discounts and refunds | Whether sales survive adjustments |
Keep the definitions consistent. For example, don’t divide purchases from every channel by website visitors from just Instagram.
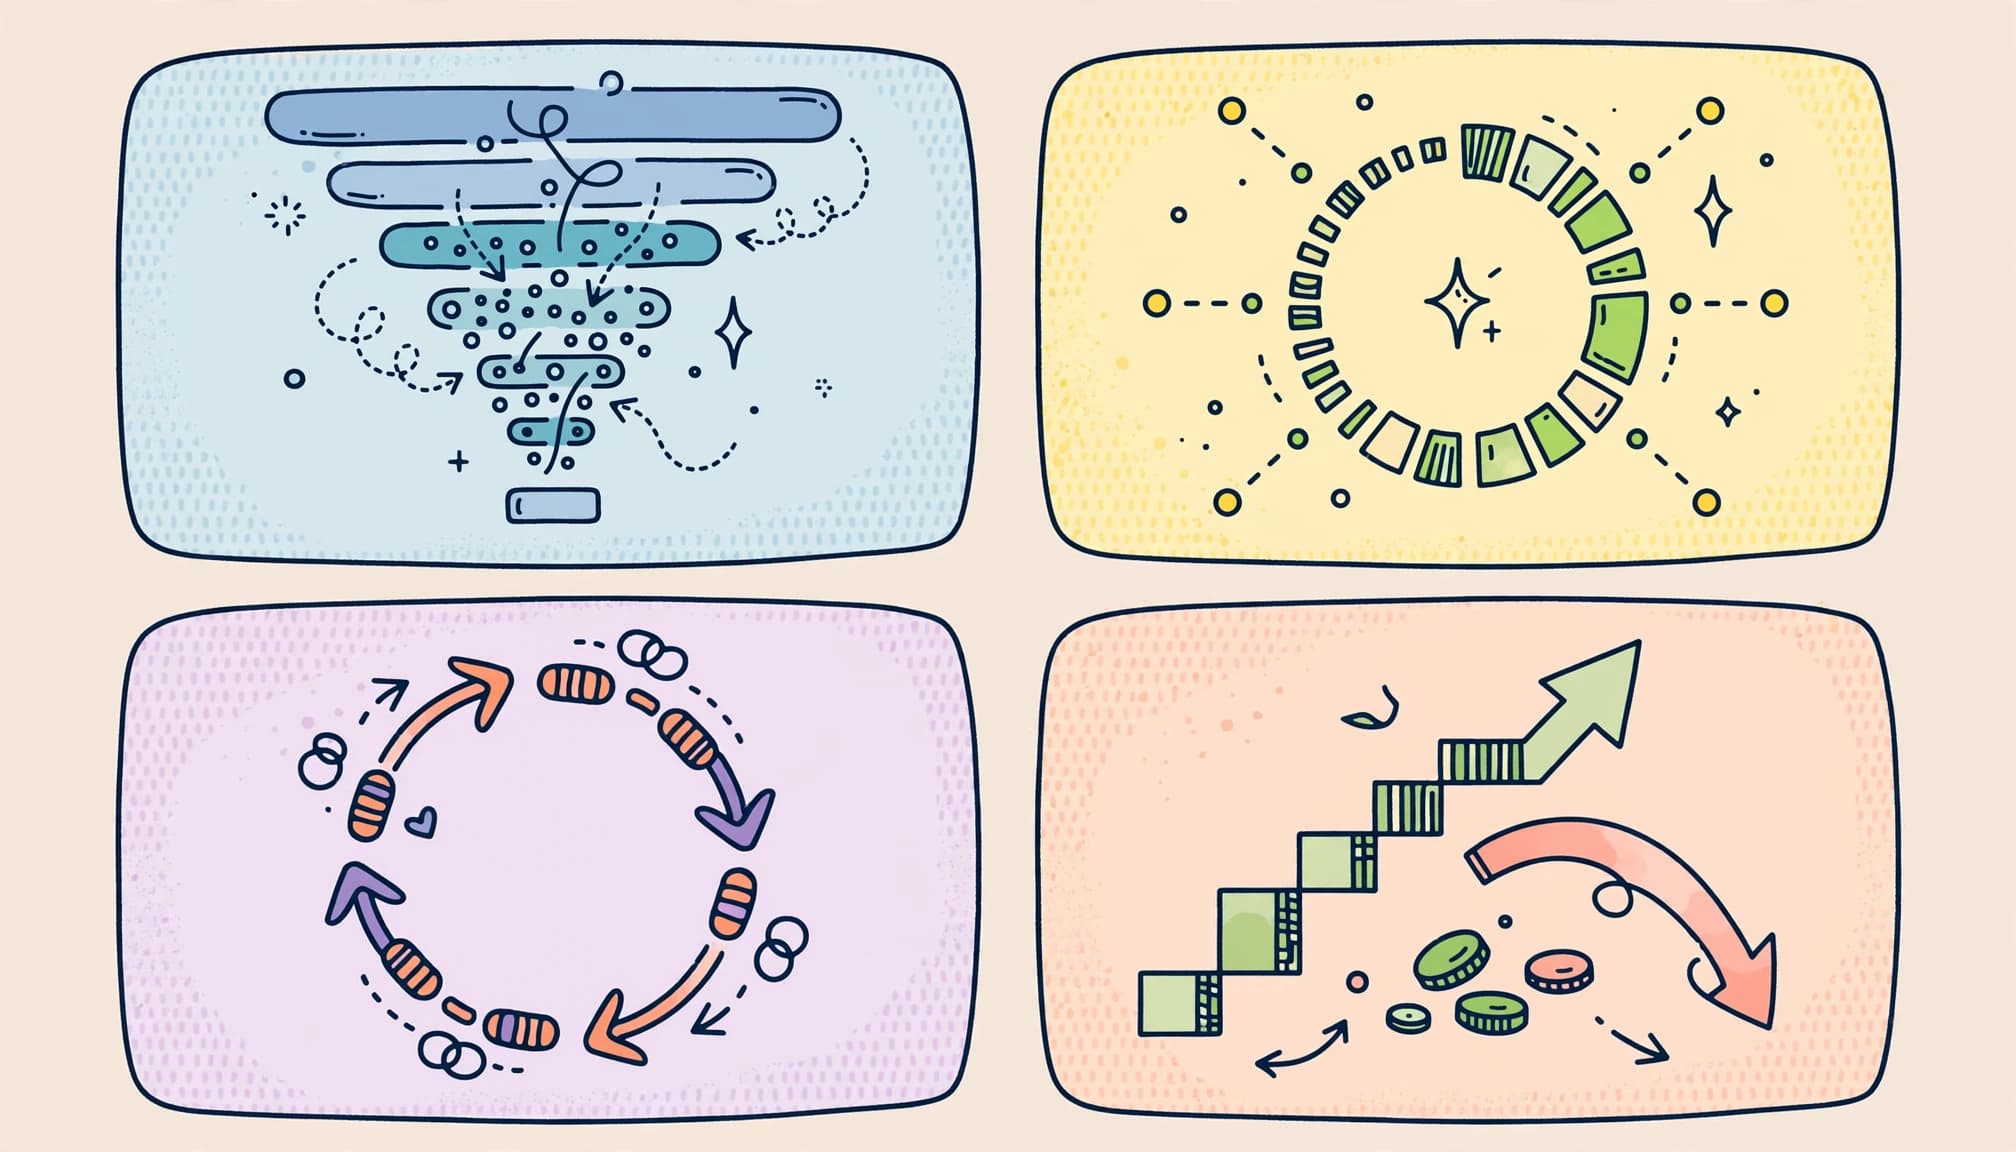
Leading indicators offer early signals of what may happen next, such as checkout starts or first-use activity. Lagging indicators capture outcomes, such as paid sales and refunds.
Compare leading indicators with lagging indicators before drawing conclusions. Strong first-use activity with weak sales suggests a different problem than strong sales followed by refund requests. Neither type tells the whole story.
Still planning the launch itself? This 30-day launch calendar for your first download shows when to set up tracking so you have clean numbers from day one.
Free: the AI Art Starter Pack
Want art to practice with? Grab a free pack of AI art images you can use to make your first printable, template or freebie, no prompting required.
Measure Acquisition Without Overcrediting a Channel
Track the path to purchase
Record product-page visits as website traffic, along with email signups, checkout starts, and completed purchases. Calculate the conversion rate from visitors to buyers, then compare drop-off between stages.
Google’s GA4 Traffic acquisition report helps identify where website visitors come from. Your checkout platform remains the source for confirmed orders and refunds.
Add campaign tags to promotional links. Google Analytics URL builders support UTM parameters that identify referring campaigns.
Use consistent names for source, medium, and campaign. Otherwise, variations in spelling can scatter one campaign across several rows and make marketing effectiveness harder to assess.
Traffic and checkout activity are leading indicators; completed purchases are lagging indicators. If signups are healthy but purchases are weak, review the offer and product marketing message. Check whether follow-up materials support sales enablement and help buyers progress. If checkout starts are healthy but payments fail, investigate checkout friction first.
Separate audiences and attribution
Report existing subscribers separately from new people in your target audience. Also distinguish discounted launch purchases from full-price sales.
Warm audiences already know you, so their results shouldn’t become your benchmark for customer acquisition through cold advertising.
A buyer may discover your art on Instagram, join your list, and purchase through an email. Record first discovery and purchase channel separately when possible.
A short post-purchase question can add context. However, self-reported answers and analytics both have gaps, so avoid claiming one channel caused every sale it touched.
Track Activation and Meaningful Product Use
Define the buyer’s first useful result
Activation means reaching an early milestone that supports the promised outcome. Early-use measures are leading indicators, while completed outcomes are lagging indicators.
For a prompt pack, ask whether the buyer generated a usable image. For an editable Canva template, check whether they customized and exported it. For a workshop, track attendance and completion of the first exercise.
Choose one milestone before reviewing results. Downloads show access, but they don’t prove successful use.
If your product works outside your platform, you may need a short follow-up survey. Use customer feedback to understand off-platform use, and report responses as respondent data, not behavior measured across every buyer.
Include the response count so you can judge how much evidence you have.
Find the onboarding bottleneck
Measure time to first useful result when your system supports it. Otherwise, ask buyers when they started and what stopped them.
Review download failures, unclear file formats, missing instructions, and repeated setup questions. For AI art beginners, required software or unfamiliar terminology can block progress.
Compare buyers receiving different onboarding versions, but change one major element at a time. That makes the result easier to interpret.
Feature adoption needs a relevant denominator. Measure feature adoption among buyers entitled to those templates, rather than everyone on your mailing list. For products designed for recurring use, track active users and user engagement among eligible buyers.
Improve the path to the first result before adding more files or features.
Read Retention Through Cohorts
Compare buyers at the same age
Cohort analysis groups people with a shared starting point, such as their purchase week. Amplitude’s explanation of cohort retention analysis describes tracking those groups as they return over time.
Use cohort analysis to compare week-one buyers after seven days with week-two buyers after seven days. Don’t compare seven-day behavior with people who purchased yesterday.
Buyers who haven’t reached a measurement window belong outside its denominator, not among the customers who failed to return.
Use cohort analysis to compare results by product, acquisition source, new versus returning customers, and feature adoption. Avoid slicing a small launch into groups too tiny to interpret.
Show counts beside percentages. A result based on three buyers deserves a different level of confidence than one based on hundreds.
Match retention to your business model
A one-time printable doesn’t require daily use to deliver value. Measure customer retention through successful use, satisfaction, and repeat purchases, rather than a subscription churn rate.
A course may need weekly progress. A membership may need recurring resource use and renewal. Track user engagement and active users at the cadence your offer promises.
For subscriptions, Stripe’s guidance on calculating customer churn defines a churn rate as customers lost during a period divided by customers at its start, multiplied by 100.
A brand-new launch with zero starting customers can’t use that denominator. Track cancellations among new subscribers separately until you have a valid starting base, and don’t report a subscription churn rate from it.
Similarly, don’t declare renewal success before customers reach their renewal date.
Connect Product Launch Metrics to Money
Separate sales from profit
Report orders, net sales revenue, and contribution after variable costs. Payment fees, affiliate commissions, and delivery expenses can change the picture.
For a digital download, low delivery costs don’t make every sale pure profit. Launch design, software, support, and advertising still require money or time. Product marketing should account for the offer and its costs when assessing whether sales are sustainable.
Track revenue growth as an observed outcome, not a forecast one month can establish.
Calculate customer acquisition cost as acquisition spending divided by new customers acquired. State which spending you included.
If you only count advertising, label the result paid acquisition cost. Don’t compare it directly with a fully loaded figure that includes staff and contractors.
Also separate new-customer purchases from existing customers buying another product. Mixing them can make acquisition look cheaper than it is.
Treat early forecasts cautiously
One month rarely establishes reliable customer lifetime value. Use observed revenue and costs, then label future repeat-purchase or retention assumptions clearly.
For workshops or coaching programs sold through calls, track qualified inquiries, booked calls, and closed deals. Define the deal cycle as the time from inquiry to decision. Calculate win rates as won deals divided by won plus lost deals.
Keep pending opportunities separate. A longer deal cycle can leave good prospects unresolved at day 30. Consider the deal cycle when interpreting the timing of results.
Record loss reasons, including price, timing, unclear outcomes, or poor fit. For larger teams, review sales enablement materials and check which ones representatives use. Track whether sales enablement materials help progress opportunities, not just whether reps view them. Asset views alone don’t prove sales enablement helped close deals.
Use Customer Feedback to Explain the Numbers
Numbers identify a problem’s location; conversations often reveal its cause. Qualitative feedback can explain what analytics can’t. Review customer feedback from support tickets, refund reasons, replies, and buyer interviews, treating refund reasons as lagging indicators.
Ask customers what they tried to accomplish, where they got stuck, and what they expected before buying. Recent actions provide stronger evidence than general compliments. A net promoter score is one possible survey measure, but it doesn’t replace behavior, response counts, or interviews.
Use customer feedback to group recurring issues in a simple log. Include the affected product, buyer type, reported problem, and proposed fix. Net promoter score can be another possible survey measure, but it still can’t replace behavior, response counts, or interviews.
If beginners repeatedly misunderstand licensing or required software, use customer feedback to update the sales page and onboarding before spending more on promotion. Strong product marketing makes the promise and requirements clear.
If qualified visitors don’t buy, compare customer feedback with the promise and audience. The same principles used to validate a digital product idea remain useful after launch.
For PLR-based offers, use customer feedback to check whether the material matches the buyer’s immediate task. Choosing audience-fit PLR products matters more than adding a larger bundle.
Avoid adding features to compensate for weak demand. First establish whether buyers want the result you’re offering.
Follow a Practical First-Month Review Rhythm

Use scheduled reviews so launch-day excitement doesn’t dictate every change.
- Days 1 to 3: Verify purchase tracking, payment processing, download access, and campaign tags. Fix technical failures immediately.
- Days 4 to 7: Review traffic quality, conversion steps, feature adoption, and support questions. Use leading indicators to spot a likely bottleneck, but wait for the review window and enough evidence before changing course.
- Days 8 to 14: Use cohort analysis to compare eligible purchase groups and audience segments. Test one change, such as clearer instructions or a revised offer headline.
- Days 15 to 30: Review revenue, costs, refunds, repeat engagement, and available renewals. For offers built around recurring activity, include active users. Decide what to continue, revise, or stop.
A solo creator can combine Gumroad or Stan Store order records, website analytics, and a spreadsheet. Keep customer feedback, including survey responses and interview notes, alongside the numbers.
Larger teams should assign an owner to each metric and align definitions across marketing, product, finance, and sales enablement. Reconcile order totals before debating channel performance.
Set decision rules before each test. Choose the outcome, review date, and amount of evidence needed to make a change.
Benchmarks vary by product, price, audience, and buying cycle. Use pre-launch evidence and your own comparable groups before adopting someone else’s target.
Likes and impressions become useful when they help explain qualified traffic or purchases. Without that connection, they provide little direction.
Keep learning
If the numbers show buyers stalling after purchase, fix digital product delivery after checkout first, then look at why buyers request refunds. For traffic, Pinterest is one of the easiest channels to measure. Here’s how I make Pinterest images for blog posts with ChatGPT:
Skip the blank page
The AI Art & Marketing Club gives you fresh art, a product plan and a marketing plan every month, so you always know what to make and how to sell it. Prefer to buy one pack at a time? The shop has themed art packs, prompt packs and bundles ready to customize.
Club and shop art can be used to create new finished products that you sell with commercial, PLR or MRR rights. The original images can’t be resold or given away as-is. Full license terms.
Frequently Asked Questions
What product launch metrics should I track in month one?
Start with a compact dashboard of qualified traffic, purchase conversion, activation, repeat engagement, refund rate, and net sales revenue. Choose measures that answer a business question and keep their definitions consistent.
What is the difference between leading and lagging indicators?
Leading indicators, such as checkout starts or first-use activity, offer early signals about what may happen next. Lagging indicators, such as completed purchases and refunds, show outcomes that have already occurred.
How should I measure product activation?
Define one early milestone that shows a buyer has reached a useful result, such as generating a usable image or completing a workshop’s first exercise. Downloads show access, but they don’t prove successful use.
Can I use month-one results to forecast customer lifetime value?
One month rarely provides enough evidence to establish reliable customer lifetime value. Report observed revenue and costs, and clearly label any assumptions about future retention or repeat purchases.
How do I know what to change after launch?
Compare the metrics with customer feedback to identify the clearest observed bottleneck, such as weak conversion, delivery problems, or onboarding friction. Set a review date and change one major element at a time so you can interpret the result.
Turn the First Month Into a Better Next Step
Assess product launch success through buyer behavior, meaningful outcomes, and the right context, not launch-day attention alone. Purchases show commitment; first-use outcomes show whether your offer delivers.
Keep your dashboard small, compare equivalent groups, and pair numbers with customer feedback. Your next change should address the clearest observed bottleneck, rather than the loudest launch-day signal.
Share On Pinterest!
Want to come back to this later? Save one of these pins to your Pinterest board.





One Comment